Email data from thousands of curated ecommerce brands.
Our MailCharts Index includes 2,500+ hand-picked brands representing a wide spectrum of industry groups.
Learn more
-

Every brand in the MailCharts Index has been vetted and curated by our data team.
-

View email data from household names to up-and-coming startups.
-

Explore email insights and reporting for every brand in our index.
-

Discover new brands and broaden your competitive spectrum.
MailCharts collects email data from the world’s most popular brands.

- USA
- 2,063 emails received

- US
- 1,568 emails received
- USA
- 4,113 emails received

- US
- 1,864 emails received

- USA
- 4,931 emails received

- UK
- 1,528 emails received

- USA
- 1,267 emails received

- Canada
- 122 emails received
Brands in the MailCharts Index
Browse and view insights for over 2,500 brands in the MailCharts Index
A - 246 brands
- AAA
- Aab
- Aaptiv
- Aarmy
- AARP
- AbbVie
- ABC Carpet & Home
- Abercrombie & Fitch
- Abercrombie & Kent
- AbsoluteJOI
- Abt Electronics
- Academy Sports + Outdoors
- Accenture
- Accessorize USA
- Accor Hotels
- Ace Hardware
- Acer
- Ace & Tate
- Acme Fresh Market
- Acne Studios
- Acorns
- ActiveCampaign
- Act-On Software
- Adairs (Australia)
- Adams Golf
- ADAY
- Ad Council
- aden + anais
- Adidas USA
- ADI Global Distribution
- ADL - Anti-Defamation League
- Adobe
- Adorama
- Adore Me
- Advance Auto Parts
- Aegean Airlines
- AERIN LLC
- Aer Lingus
- Aeropostale
- Aerosoles
- Aesop
- Afeela
- Affliction Clothing
- AFTCO Fishing
- Agilent Technologies
- AG Jeans
- Agoda
- AHAlife
- AHAVA
- Ahold Delhaize
- Ahrefs
- AIDS Healthcare Foundation
- Airbnb
- Air Canada
- Air Europa
- Air New Zealand
- Air New Zealand
- Airtable
- AIRWAAV
- AJ Madison
- Alala
- Alamo Rent A Car
- Alan Meds
- Alaska Airlines
- ALASTIN Skincare
- Albee Baby
- AlbertaFerretti
- Albertsons
- Albion Fit
- ALDI
- ALDO
- Alen
- Alex and Ani
- Alexander McQueen
- Alexander Wang
- Alexis Bittar
- Alexis Russell
- Alibaba
- Alibris
- alice + olivia
- AliExpress
- Align Probiotics
- AlixPartners
- Allbirds
- All-Clad Metalcrafters
- Allegiance Flag Supply
- Allegiant Air
- Allen Edmonds
- AllHeart
- Alligator Performance
- Allivet
- AllModern
- Alloy Apparel
- AllPosters
- ALLSAINTS (United Kingdom)
- Allstate
- Allurez
- Ally Fashion
- ALOHA
- Alo Yoga
- Alpha-H (Australia)
- Alphalete Athletics
- Alpha Paw
- Altra Running
- Altria
- Alzheimer's Foundation of America
- Alzheimer's Society
- Amazon
- Amazon AWS
- Amazon Freight
- Amazon Shipping
- Ambre Blends
- AMC Theatres
- American Airlines
- American Animal Hospital Association (AAHA)
- American Cancer Society
- American Eagle Outfitters
- American Furniture Warehouse
- American Giant
- American Girl
- American Greetings
- American Heart Association
- American Home Shield
- American Red Cross
- American Regent
- American Signature
- American Standard Plumbing
- American Tourister
- American Trucks
- American Veterinary Medical Association (AVMA)
- Amgen
- Amok Time Toys
- Amplitude
- Amy Porterfield
- Amy's Kitchen
- Anastasia Beverly Hills
- Ancestry
- Andie
- Angara
- Animal League
- Anker
- Annie Selke
- Annmarie Gianni Skin Care
- Ann Summers
- Ann Taylor
- Ansira
- Anthropic
- Anthropologie
- Antica Farmacista
- ANYCUBIC
- Anytime Fitness
- Aosom
- AO (United Kingdom)
- APC
- Apothekary
- Applause
- Apple
- Applebee's
- Apt2B
- AptDeco
- Arby's
- Arc’teryx
- Arctic Fox
- Arctic Wolf
- Arena
- Arhaus
- Ariat International Inc
- ARKET
- ARLO SKYE
- Armani
- Armani Exchange
- Armoire
- ARMRA
- Art
- Artbeads
- Arteriors Home
- Artful Home
- Artfully Walls
- Article
- Artifact Uprising
- artiplanto
- Artipoppe
- Artisanal Cheese
- Artist & Craftsman Supply
- Art Karat
- artnet
- Art of Tea
- Artsy
- Asana
- Ashford
- Ashley Furniture HomeStore
- Ashley Furniture Industries
- Ashley Stewart
- ASICS
- AskMen
- ASMALLWORLD
- ASOS
- ASOS (United Kingdom)
- Astley Clarke
- Astral Tequila
- ASUS
- Athleta
- Athletic Greens
- At Home
- Atkins
- Atlanta Falcons
- Atlanta Hawks
- Atlantis, The Palm Dubai
- Atlantis, The Royal Dubai
- Atlas Coffee Club
- Atoms
- Atom Tickets
- AT&T
- Attentive
- Audemars Piguet
- Audry Rose
- Auntie Anne's
- Aura Bora
- Aurahome (Australia)
- AUrate New York
- Austin American-Statesman
- Australian Rugby Union (Australia)
- Authenticity 50
- AutoAccessoriesGarage
- Autodesk
- Autom
- AutoZone
- Avalara
- Avast Software
- Aveda
- Aveeno
- Aventon Bikes
- Avenue Stores LLC
- Aviation American Gin
- Avis Car Rental
- Avocado Green Mattress
- Avon
- Avoya Travel
- AVTechnology
- Awake Window & Door Co.
- Away
- AXE
- Axios
- AYR
- Azamara Club Cruises
- AZAZIE

Engagement Marketing Manager
@ Airbnb
You have a team of loyal email geeks at Airbnb.
Head of Fan Engagement
@ NBA
MailCharts has helped us stay up-to-speed on email best practices and innovation, and has served as a source of inspiration as we look to up our email game.

Content Marketing Manager at AWeber
I'm loving the platform. We're updating a lot of our email template designs and the examples we're getting from Mailcharts are really helpful.
Strategic Account Director at Cheetah Digital
Unfortunately I gave up on tracking a gmail inbox as I never managed to sort through it!

Thousands of brands at your fingertips
2,500+ Brands organized into over 80 Industry Groups
The MailCharts Index is a curated collection of brands organized into sought-after industry groups. We created the MailCharts Index to help ecommerce email marketers quickly research and plan email campaigns from strategy to execution.
MailCharts collects emails from 2,500+ of the most popular ecommerce brands — from household names to the newest direct-to-consumer businesses and start-ups.
You’ll find the brands that matter the most: your competitors and peers, brands you love and brands whose email programs are so good you’ll want to get under the hood to see how they work.
Historical email data since 2013
Since 2013 we’ve been building a comprehensive database of email messages, but we’re not just an email warehouse.
We use our extensive email collection to generate deep understanding of marketing calendars, email journeys and promotional cadences of our curated brands. As a MailCharts user, you can take advantage of our research to help you gather detailed industry insights and zoom out into the broader ecommerce world.

How we curate our brands
MailCharts focuses on growing and refining the MailCharts Index. It’s designed to be a valuable resource for ecommerce email marketers and others looking for data, insights, and trends in all phases of email marketing.
We’re constantly finding brands through research, discovery, and customer suggestions. We look for brands that are popular, trending, high-growth, or established – or a combination of these criteria.
We work hard to identify the right brands for our collection:
- Discovery: We scout the ecommerce world looking for the latest and greatest, adding brands that we’ve seen in retail, ecommerce, marketing and email industry news or that we’ve discovered in our own ecommerce travels. If it’s an ecommerce brand that’s doing something interesting, outstanding or innovative with email marketing, we’ll add it to the dataset and begin compiling data.
- Suggestions: We listen to our customers and have created a list of the most requested and tracked brands over the past 6 years. These include popular, established, market-leading brands along with DTC, subscription commerce, specialty and gender-specific brands.
- Talked about: Brands ranked as top performers on recognized ecommerce industry lists:
- Internet Retailer Top 1000
- Interactive Advertising Bureau 250
- 2PM
- SailThru 250
Why doesn’t MailCharts track every brand?
MailCharts doesn’t track every brand, and that is part of our strategy. What we do have is thousands of curated brands that allow ecommerce email marketers to dominate their campaigns using competitive data and intelligence.
When you see a brand in the MailCharts Index, you know it meets these criteria:
- Hand-selected for inclusion
- Focused on retail/ecommerce (B2C and DTC)
- Has a robust and active email marketing program
- Is classified into one of over 80 industry groups covering categories such as Apparel, Footwear, and Travel & Tourism
You won’t find every brand in the MailCharts Index. But you’ll find the top brands and data you can use right away for your most effective campaign planning and execution. And if you don’t find the exact brands you’re looking for in the Index, you can look to similar brands for data, insights and email creative for competitive research.
We continually investigate and evaluate brands for inclusion in the MailCharts Index. If you have a retail or ecommerce brand you’d like us to consider, feel free to contact us with the information.

Our data is built for ecommerce marketers
The Mailcharts Index offers exactly what ecommerce email marketers need to develop their competitive strategies and plan and execute their email programs.
The 2,500+ brands in the MailCharts Index represent a wide spectrum of email programs, all important to email marketers. Each hand-selected brand has a strong email program, including promotional and triggered messages. Together, the Index represents the most up-to-date collection of premium email designs to inspire your creativity, and provides searchable data, insights, and analysis to help you research and plan campaigns quickly and efficiently.
How MailCharts helps you
MailCharts has one goal – to provide actionable data and information that help ecommerce email marketers do their jobs better.
Using our data, marketers can gain insight to plan their marketing programs, get inspiration from hundreds of different brands without having to maintain a separate email account or compile competitive industry reports.
Here are some of the ways you can use MailCharts every day:
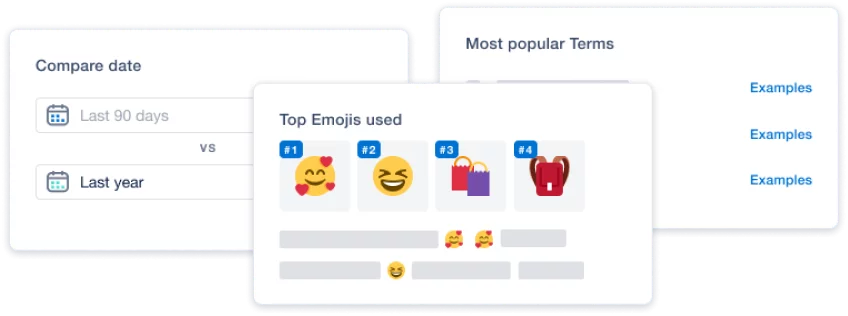
- Discover the broader competitive spectrum. This allows you to see what your customers are seeing. You’ll find curated industry groups that show you the broad picture of your industry and the entire world of ecommerce. Look at your competitors and peer brands, and get out in front of brands. Perform in-depth reporting, including benchmarking and brand comparisons, and make informed decisions.
- Gain easy access to actionable information. Gathering and organizing data is hard and time-consuming. We know because we’ve been doing it for years. MailCharts does data gathering and visualization so you can compare and improve your valuable user journeys. We also share details about welcome series, cart abandonment programs, and gender-specific promotions.
- Use the past to predict the future. Year-over-year campaign data helps you see the past so you can predict the future and plan for weeks, months, and quarters ahead.
Other ways to explore our data:
- Industry Groups: We curated groups of brands to help you gain insight into information and trends in popular industries like Apparel, Beauty, Gifts, Home, Sports & Activities, Travel & Tourism and Food & Drink.
- Email examples: MailCharts gives you the power to curate your own lists of favored brands and email examples. But you can also check our custom email lists with hundreds of email examples to choose from. This quick-start tool will get you planning your triggered campaigns and upcoming promotions right away.
- Holidays: See our strategy pages for all major holidays with curated email lists and campaign examples for inspiration.
- Journeys: Journeys are our proudest accomplishment. Our team has been triggering, collecting, and classifying emails for years and we have thousands of examples of journeys like these:
- Welcome and onboarding programs
- Abandoned-cart and abandoned-browse emails
- Purchase and shipping confirmations
- Re-engagement campaigns
Contact us to get started
Sign up now and unlock access to thousands of brands and emails along with competitive data, analysis, and ecommerce insights.